We’re planning to regularly solicit stats questions on our new Patreon, and today I’m going to spend some time crunching numbers in response to one of the submissions. (This is also a fortuitous opportunity to answer a question that was apparently lost in our inbox from before the pandemic! I admit e-mail bankruptcy was declared at some point in 2021…) If there’s something you’ve wondered that our data might be able to answer, drop us a line in a future post!
While the game score does not factor into the rating calculation—the fundamental unit in competitive Magic is a match, not a game—it is still the case that the results pages typically come with a game score. Julian Wellman asks whether there’s anything we can learn from the game scores. Questions abound here: is a 2-0 result vs. a 2-1 result random, essentially a coin flip? Is there a different distribution in GPs versus PTs? In limited matches compared to constructed matches? If there’s a big rating gap between the two players, is the higher-rated player more likely to win 2-0? I’m sure there’s plenty more that we can look at, but just touching upon these will more than fill up the rest of this post.
Since we’re going to be looking at ratings data, we should implement a provisional ratings period so that we don’t look at a player until they’ve had a chance to get a little closer to accurately rated. To that end, I’ve ignored every player’s first 20 matches. This also has the benefit of clearing out a lot of data errors, as most of them won’t have 20 matches to their name. There are also some rounds scattered throughout the database that didn’t have useful results pages; I was able to reverse engineer the results by looking at how the standings changed from round to round, but there wasn’t enough information to create the game scores. Those rounds all necessarily got culled as well. Finally, I passed over any match that involved a player going 0-1 drop from an event; probably some small percentage of them represented Magic being played, but no-shows are represented as 2-0 wins and that could have a minor effect on the numbers. (Clearing day 2 no-shows would have been tougher but is certainly theoretically possible; that’s a job for another day.)
After we apply these filters, our dataset is 952,106 matches between “veterans” with a 2-0 or 2-1 result. Split by event type and format, here’s the percentage of matches that end with a 2-0 game score.
| format | 2-0 matches | / | total | ||
| all | all | 497223 | / | 952106 | 52.22% |
| constructed | 287977 | / | 564262 | 51.04% | |
| limited | 209246 | / | 387844 | 53.95% | |
| PTs | all | 77313 | / | 150641 | 51.32% |
| constructed | 47342 | / | 94408 | 50.15% | |
| limited | 29971 | / | 56233 | 53.30% | |
| non-PTs | all | 419910 | / | 801465 | 52.39% |
| constructed | 240635 | / | 469854 | 51.21% | |
| limited | 179275 | / | 331611 | 54.06% |
It seems that matches are very slightly biased in favor of ending 2-0 rather than 2-1, and that this effect is stronger in limited than in constructed, and is weaker in PTs compared to other event types. I’m sure you can offer an explanation that’s as good as mine here, but I’m not surprised that there’s a minor correlation between winning game one and winning game two. I assume the ability to test specific matchups in constructed, plus the effect of targeted sideboard cards, likely accounts for some of the format effect?
Why is it that PT matches are more competitive than others, more frequently going to game three? Maybe stratifying by rating will give us a partial explanation here. Possibly some of the effect is due to the players being more evenly matched, and if so we should see matches between players with similar ratings have a higher 2-0 percentage than matches between players with a bigger rating gap. Here’s what we see:
| all | rating interval | total matches | higher rated player win% | ℙ(2-0 | win) (% of higher rated player wins that were 2-0) | ℙ(0-2 | loss) (% of higher rated player losses that were 0-2) |
| (0, 50] | 214151 | 50.89% | 52.34% | 51.57% | |
| (50, 100] | 190369 | 53.23% | 52.99% | 51.07% | |
| (100, 150] | 156690 | 54.97% | 53.50% | 50.32% | |
| (150, 200] | 121310 | 56.92% | 54.09% | 49.53% | |
| (200, 250] | 089770 | 58.88% | 54.40% | 48.96% | |
| (250, 300] | 064855 | 60.80% | 55.48% | 48.43% | |
| (300, 350] | 044512 | 62.12% | 55.11% | 48.06% | |
| (350, 400] | 029678 | 63.79% | 55.59% | 47.18% | |
| (400, 450] | 018549 | 65.11% | 57.04% | 47.82% | |
| (450, 500] | 010724 | 66.12% | 57.03% | 46.33% | |
| (500, 550] | 005939 | 67.49% | 57.86% | 47.54% | |
| (550, 600] | 003024 | 68.25% | 58.91% | 44.38% | |
| (600, 650] | 001477 | 68.65% | 60.85% | 47.73% | |
| (650, 700] | 000637 | 66.72% | 57.88% | 47.17% | |
| (700, 750] | 000258 | 73.26% | 65.61% | 34.78% | |
| total | 952106 | 55.80% | 53.84% | 50.18% |
Some thoughts:
-
To be clear about how to read the table, let’s look at the (300, 350] row. These are matches between “player A” who is rated between 300 and 350 points above their opponent, “player B.” There are 44512 such matches in our dataset.
- Player A wins 62.12% of them. (27649/44512 if you’re counting.)
- If we look at just the matches where player A wins, 55.11% of the time the game score is 2-0. (Thus in 44.89% of wins the game score is 2-1.)
- If we look at just those matches where player A loses, in 48.06% of them, they lose 0-2. (Hence in the other 51.94% of losses, player A won a game.)
- The raw numers for this row are: 44512 matches; 15238 matches where the higher player wins 2-0; 12411 matches where they win 2-1; 8579 matches where they lose 1-2; and 8104 matches where they lose 0-2. (The table uses percentages since the conditional probabilities can be compared across rows more immediately.)
-
Lo and behold, the fourth column increases! This is saying that rating disparity does have some effect on whether the match ends 2-0 or 2-1. I think this is intuitive: a significantly better player is more likely to win any individual game, not just any individual match. The effect also seems to be too large to explain by chance, even when you account for the fact that each match is a flip of a coin weighted to come up heads 53.84% of the time.
-
The fifth column decreases, too. So stronger players are less likely to lose 2-0 to weaker players, and this effect seems to get stronger as the strength disparity grows.
-
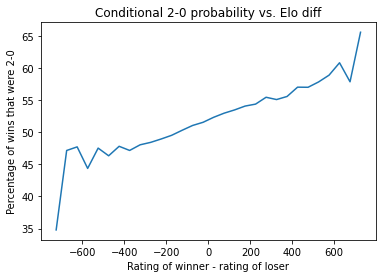
Although the table is entirely from the higher-rated player’s perspective, the fifth column is telling you what happens when the lower-rated player wins. (Of course a loss 0-2 for the higher-rated player is a 2-0 win for the lower one!) So if you can mentally flip the last one and stack it on the one next to it, you’ll have the picture for lower-rated players as well. Here’s a visualization of the percentage of matches won 2-0 graphed against the difference [winner rating] - [loser rating]. Minus some noise around the edges (where sample sizes are smaller) the correlation seems to be quite pleasingly linear.
-
The win percentage of the higher-rated player basically increases until we hit the wall in the high 60s. This is in line with the analysis I did when examining the K-constant for our rating scheme in a blog post from 2017. It’s a relief to see that the work I did then, at a time when I didn’t have 100% of the old data curated, can still be more or less replicated.
-
Where is the 52.22% number from the previous table? Remember that the first table looked at each match without singling out the higher-rated player. (And yeah, a couple of matches with elo difference exactly 0 or greater than 750 were lost, though just a few.) If you take a weighted average of the 53.84% and 50.18% numbers from the “total” row, you recover the 52.22% from before. Try throwing .5580 × .5384 + (1 - .5580) × .5018 into a calculator.
-
I saw a similar pattern when slicing the data in different ways—in blocks of 25, for example. Not surprisingly, the effect is also there when looking at events by format or by event type. For example, here’s the limited-only data, stratified by rating diff.
| limited | rating interval | total matches | higher rated player win% | ℙ(2-0 | win) (% of higher rated player wins that were 2-0) | ℙ(0-2 | loss) (% of higher rated player losses that were 0-2) |
| (0, 50] | 087328 | 50.97% | 54.25% | 52.97% | |
| (50, 100] | 077713 | 53.35% | 54.70% | 52.60% | |
| (100, 150] | 064008 | 55.34% | 54.97% | 52.16% | |
| (150, 200] | 049934 | 57.34% | 56.22% | 51.48% | |
| (200, 250] | 036673 | 59.33% | 55.97% | 50.49% | |
| (250, 300] | 026536 | 60.97% | 57.74% | 49.07% | |
| (300, 350] | 017914 | 62.07% | 57.70% | 49.89% | |
| (350, 400] | 011743 | 64.10% | 58.64% | 48.98% | |
| (400, 450] | 007315 | 65.76% | 58.17% | 48.90% | |
| (450, 500] | 004218 | 66.71% | 57.32% | 48.72% | |
| (500, 550] | 002330 | 68.03% | 59.05% | 48.59% | |
| (550, 600] | 001142 | 67.78% | 57.88% | 45.38% | |
| (600, 650] | 000569 | 66.61% | 64.91% | 51.58% | |
| (650, 700] | 000261 | 65.52% | 59.06% | 46.67% | |
| (700, 750] | 000092 | 71.74% | 62.12% | 38.46% | |
| total | 387776 | 56.01% | 55.67% | 51.76% |
Thanks again Julian for the question! I’d be more than happy to continue the discussion (on the patrons-only Discord, maybe?) and run more numbers for future installments.